



 10 minutes to read
2026-04-16
Saira Khan
EO Broker Chart Guide: Understanding Market Analysis
Charts are at the center of every trading platform. On EO Broker, they act as a visual tool that helps users follow price changes, recognize patterns, and better understand how the market behaves over time.
For new traders, learning how charts function is just as important as understanding how to place trades or manage funds.
Modern trading environments move quickly, and relying on raw numbers alone is not enough. Well-structured charts simplify complex data, making it easier to stay focused and apply a consistent approach to analysis.
This guide is intended for beginners and developing traders who want to become more comfortable using EO Broker’s charting tools in a clear and practical way.
Visit our website to explore the platform and create your account.
The Importance of Chart Selection
Not all charts present information in the same way. The format you choose can influence how you interpret price activity. Every chart type emphasizes different elements of the price.
Some chart styles highlight the overall direction of the market, while others emphasize short-term fluctuations. Without understanding these differences, it’s easy to misread what’s actually happening.
For example, on a line chart, a jump may look sharp, but on a candlestick chart, it may look like normal volatility. Learning how to switch perspectives helps avoid confusion and improves accuracy in analysis.
It’s important to remember that charts don’t forecast the future — they organize data so it’s easier to interpret.
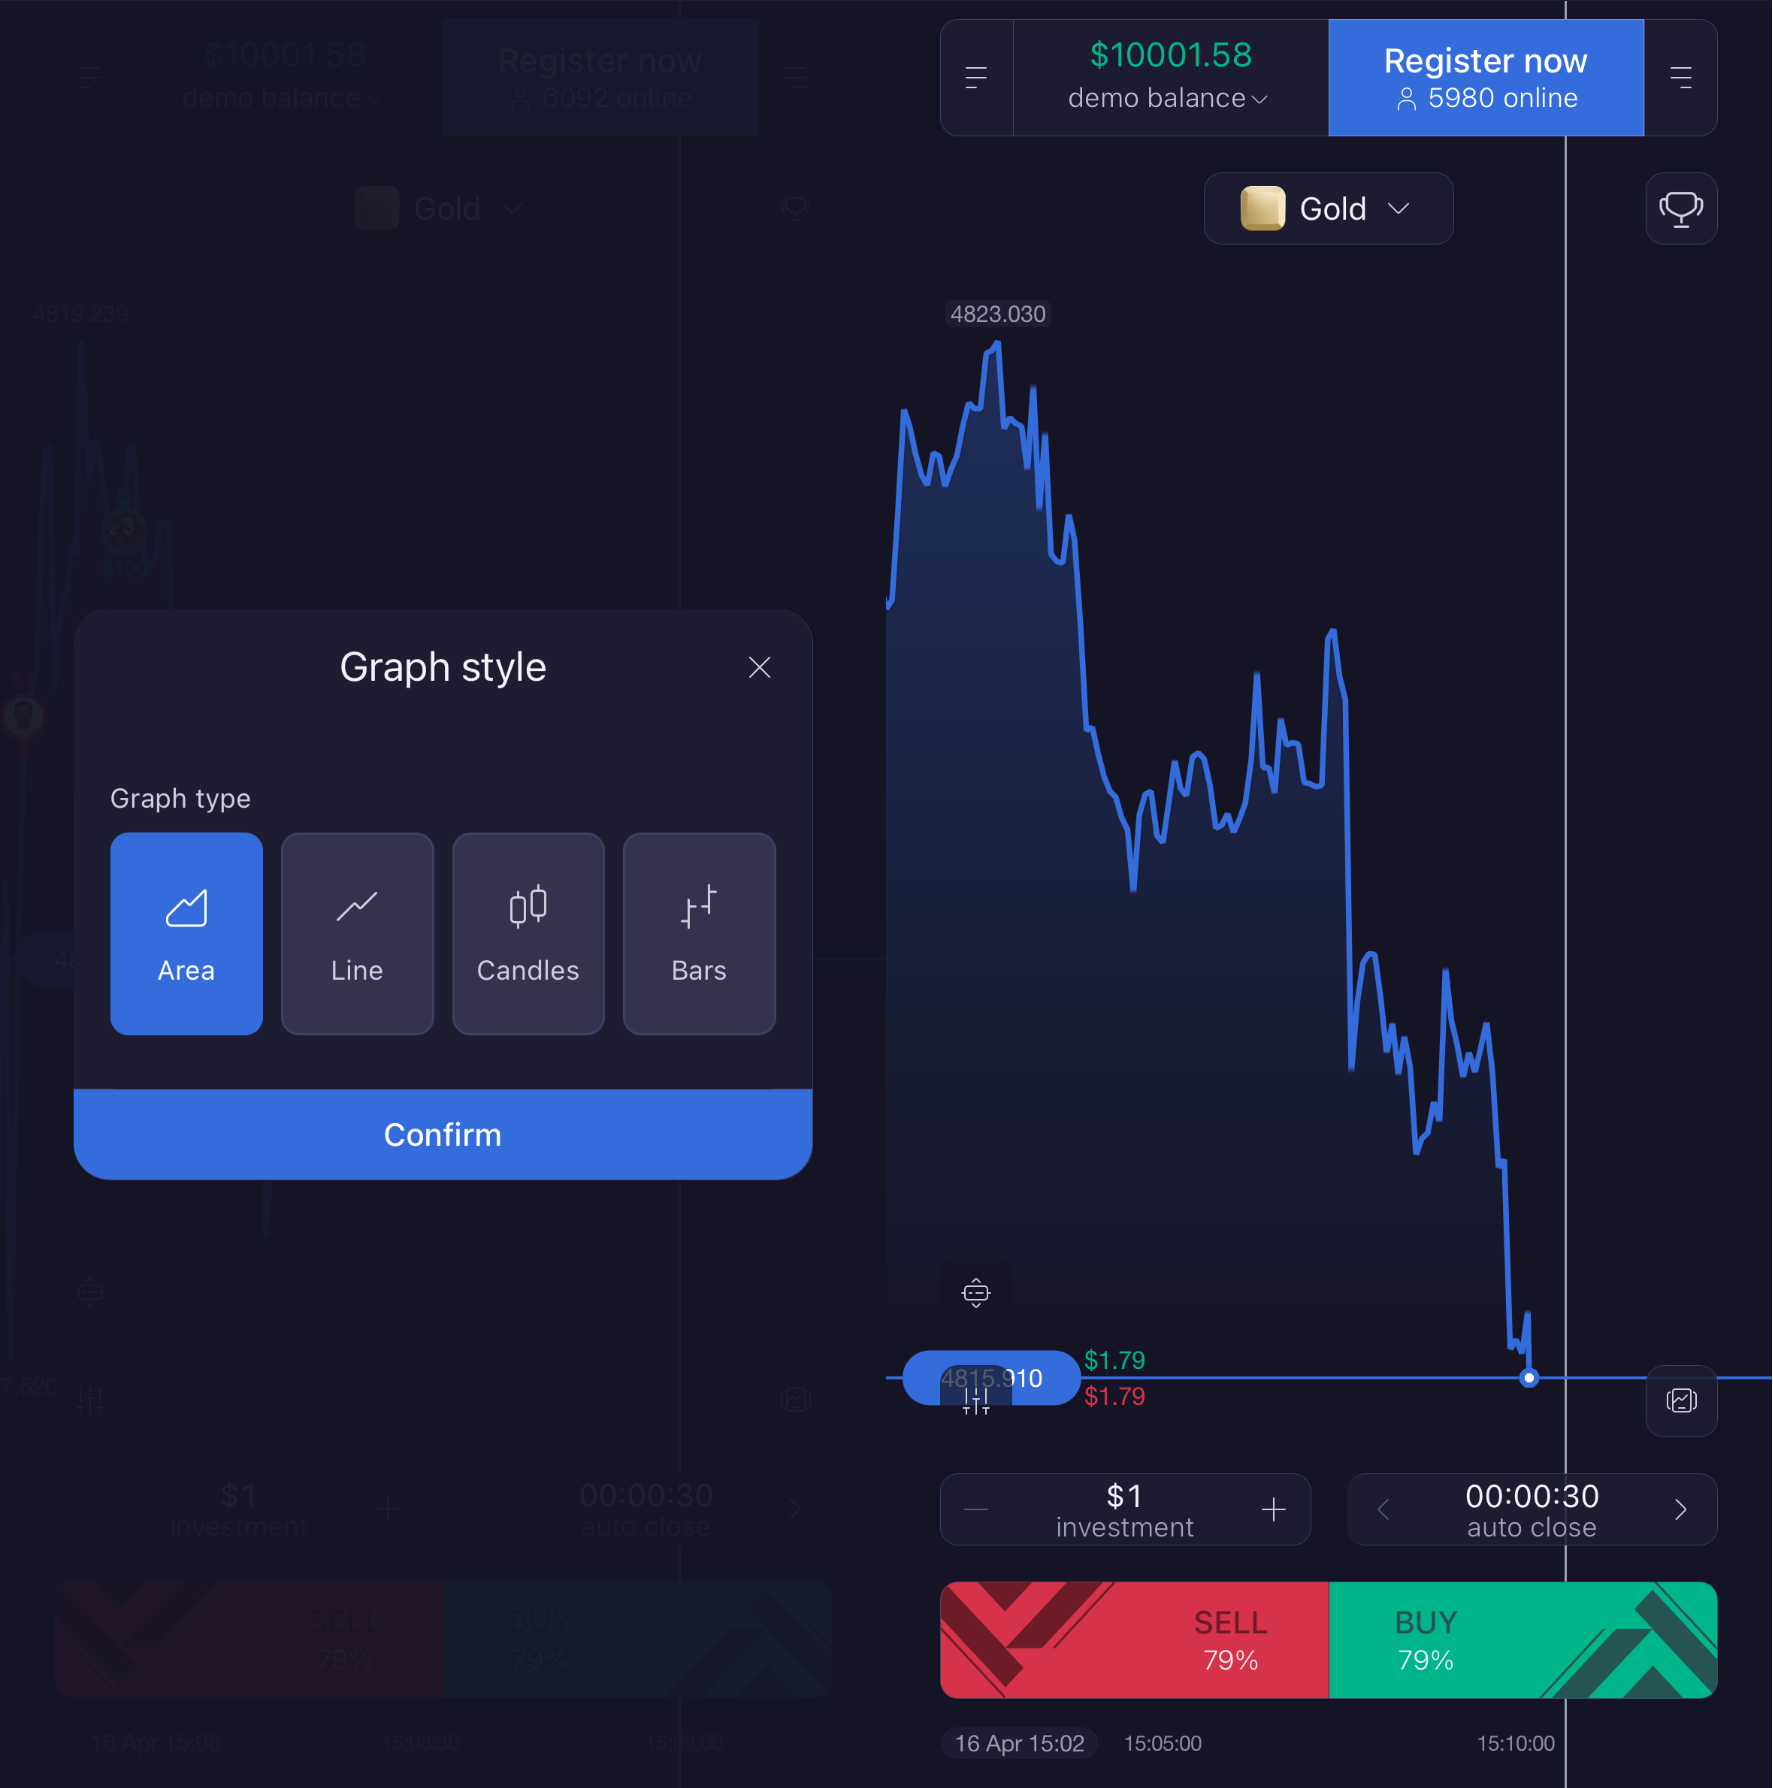
Chart Types Available on EO Broker
EO Broker includes several chart formats so users can adapt their view based on their strategy or experience level. Although each chart uses the same price data, the way it’s displayed varies.
Line Chart
This is the most straightforward chart type. It connects closing prices into a single continuous line.
Because of its simplicity, it’s often used by beginners who want a quick understanding of the market direction without extra detail.
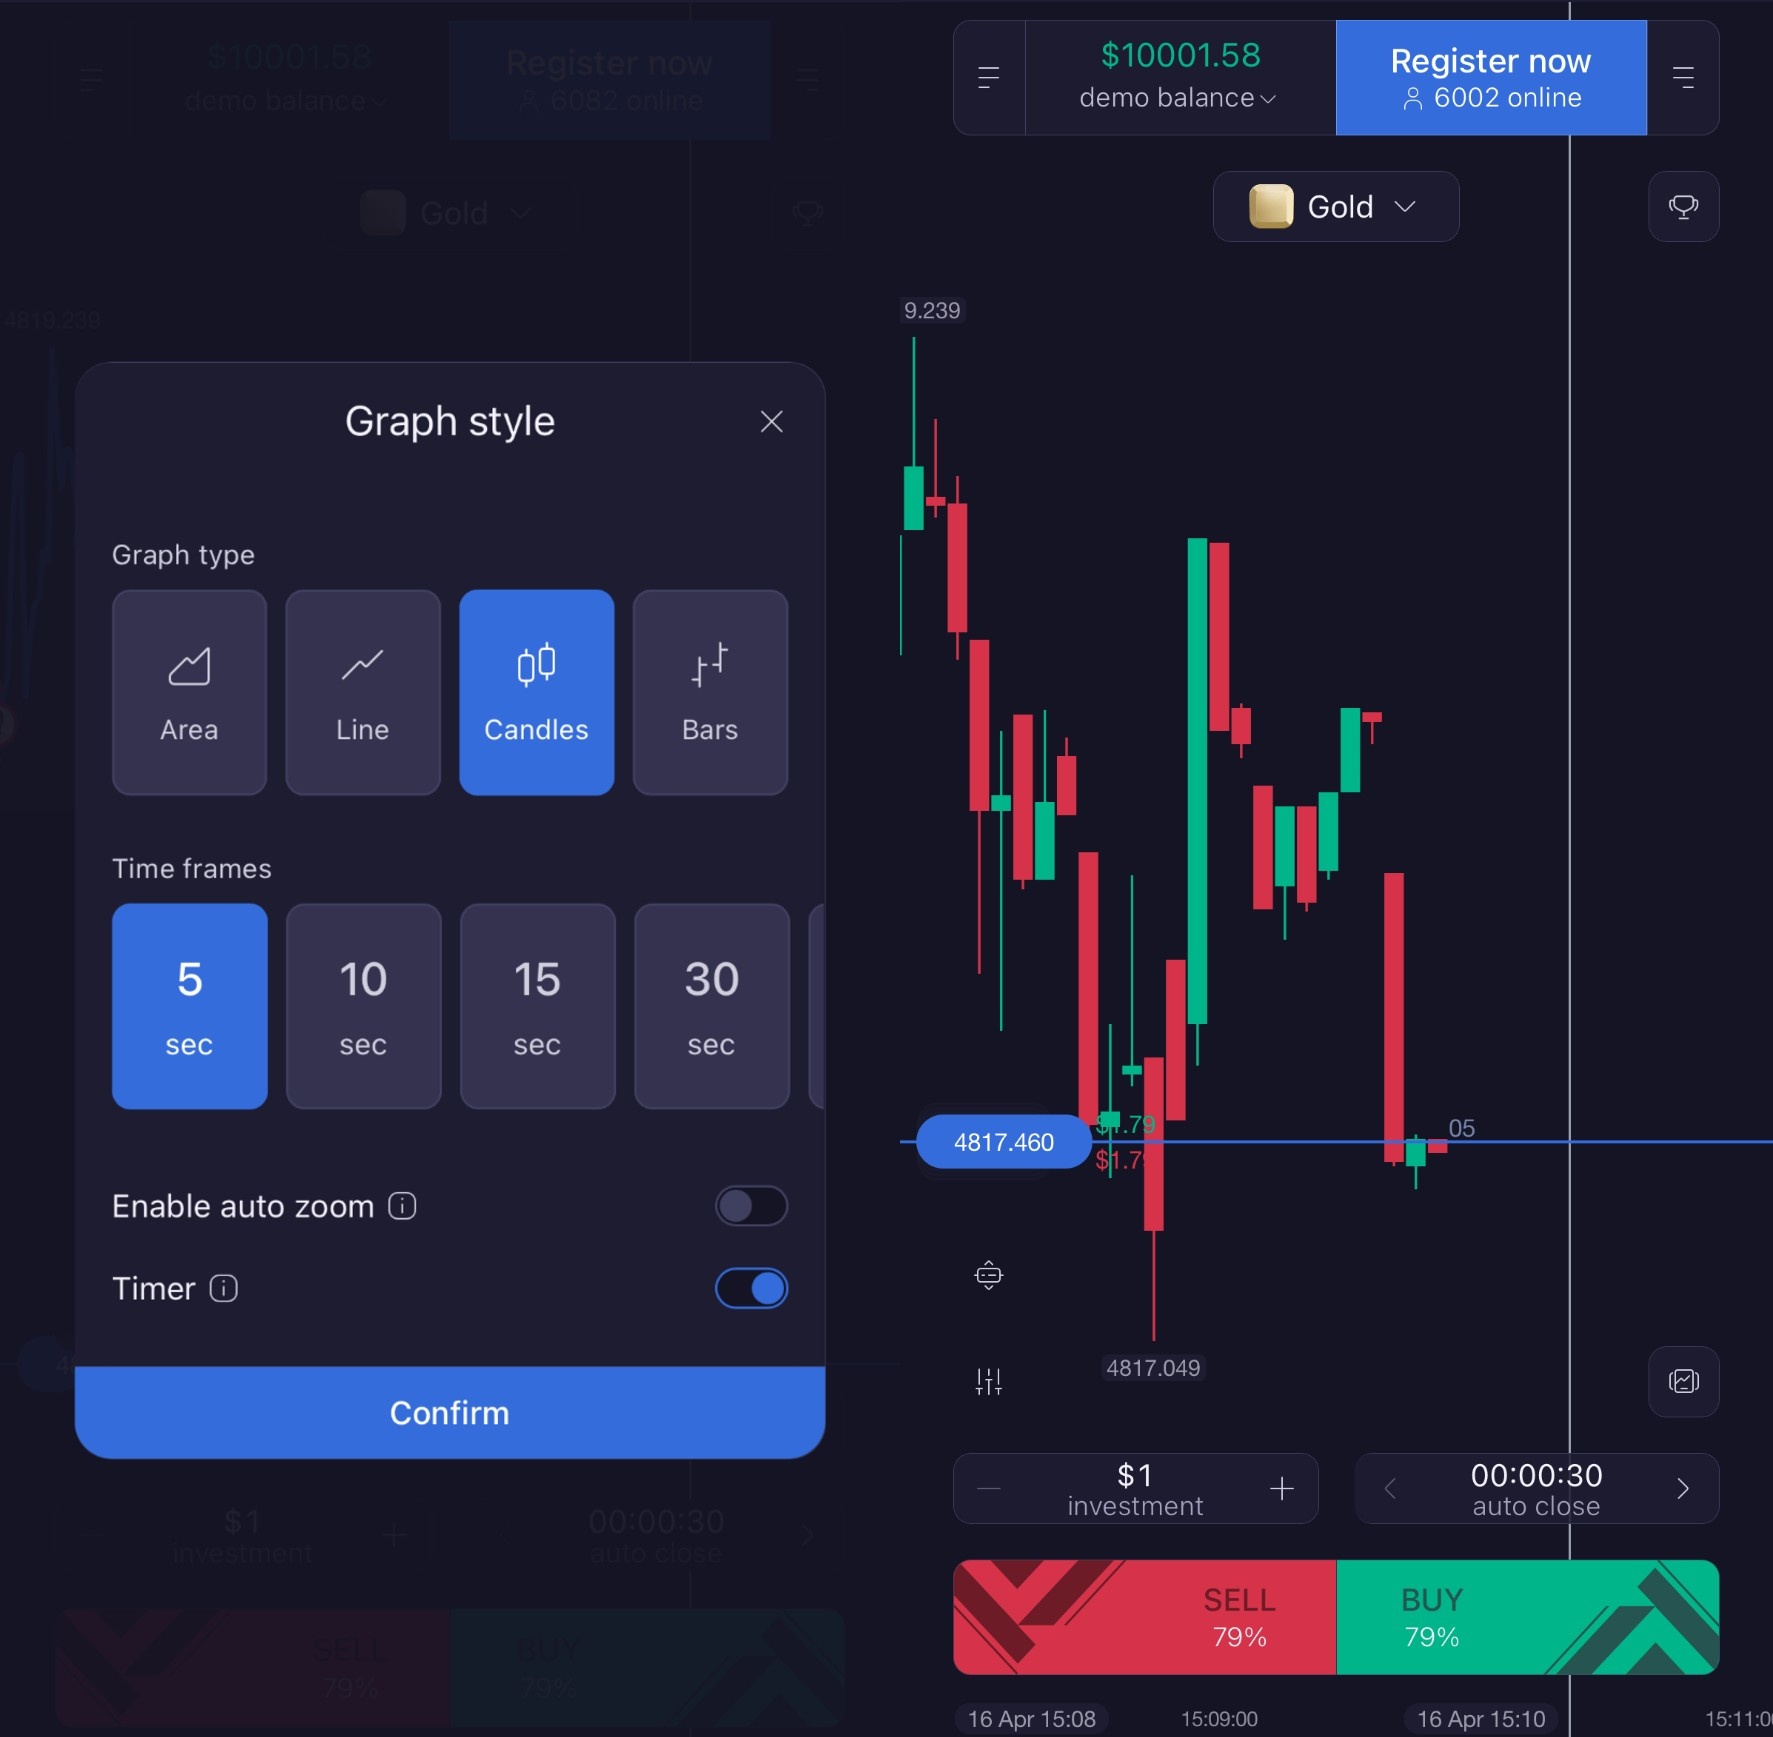
Candlestick Chart
Candlestick charts provide a more detailed breakdown of price activity. Each candle reflects opening, closing, highest, and lowest prices within a specific period.
This format is widely used because it gives a clearer picture of momentum, volatility, and short-term shifts.
Bar Chart
Bar charts show the same four price points as candlesticks but use a different visual style. They can feel less intuitive at first due to a lack of color differentiation, but experienced traders often appreciate their structured and compact presentation.
Area Chart
Area charts build on the line chart by adding shading beneath the price line. This makes trends stand out more visually and can help users quickly identify the general direction without focusing on fine details.
Each option offers a different perspective, and switching between them can improve overall understanding.
Why Personalizing Charts Matters
Using default settings may not always provide the clearest view. Adjusting chart elements can make a significant difference in how easily data is interpreted.
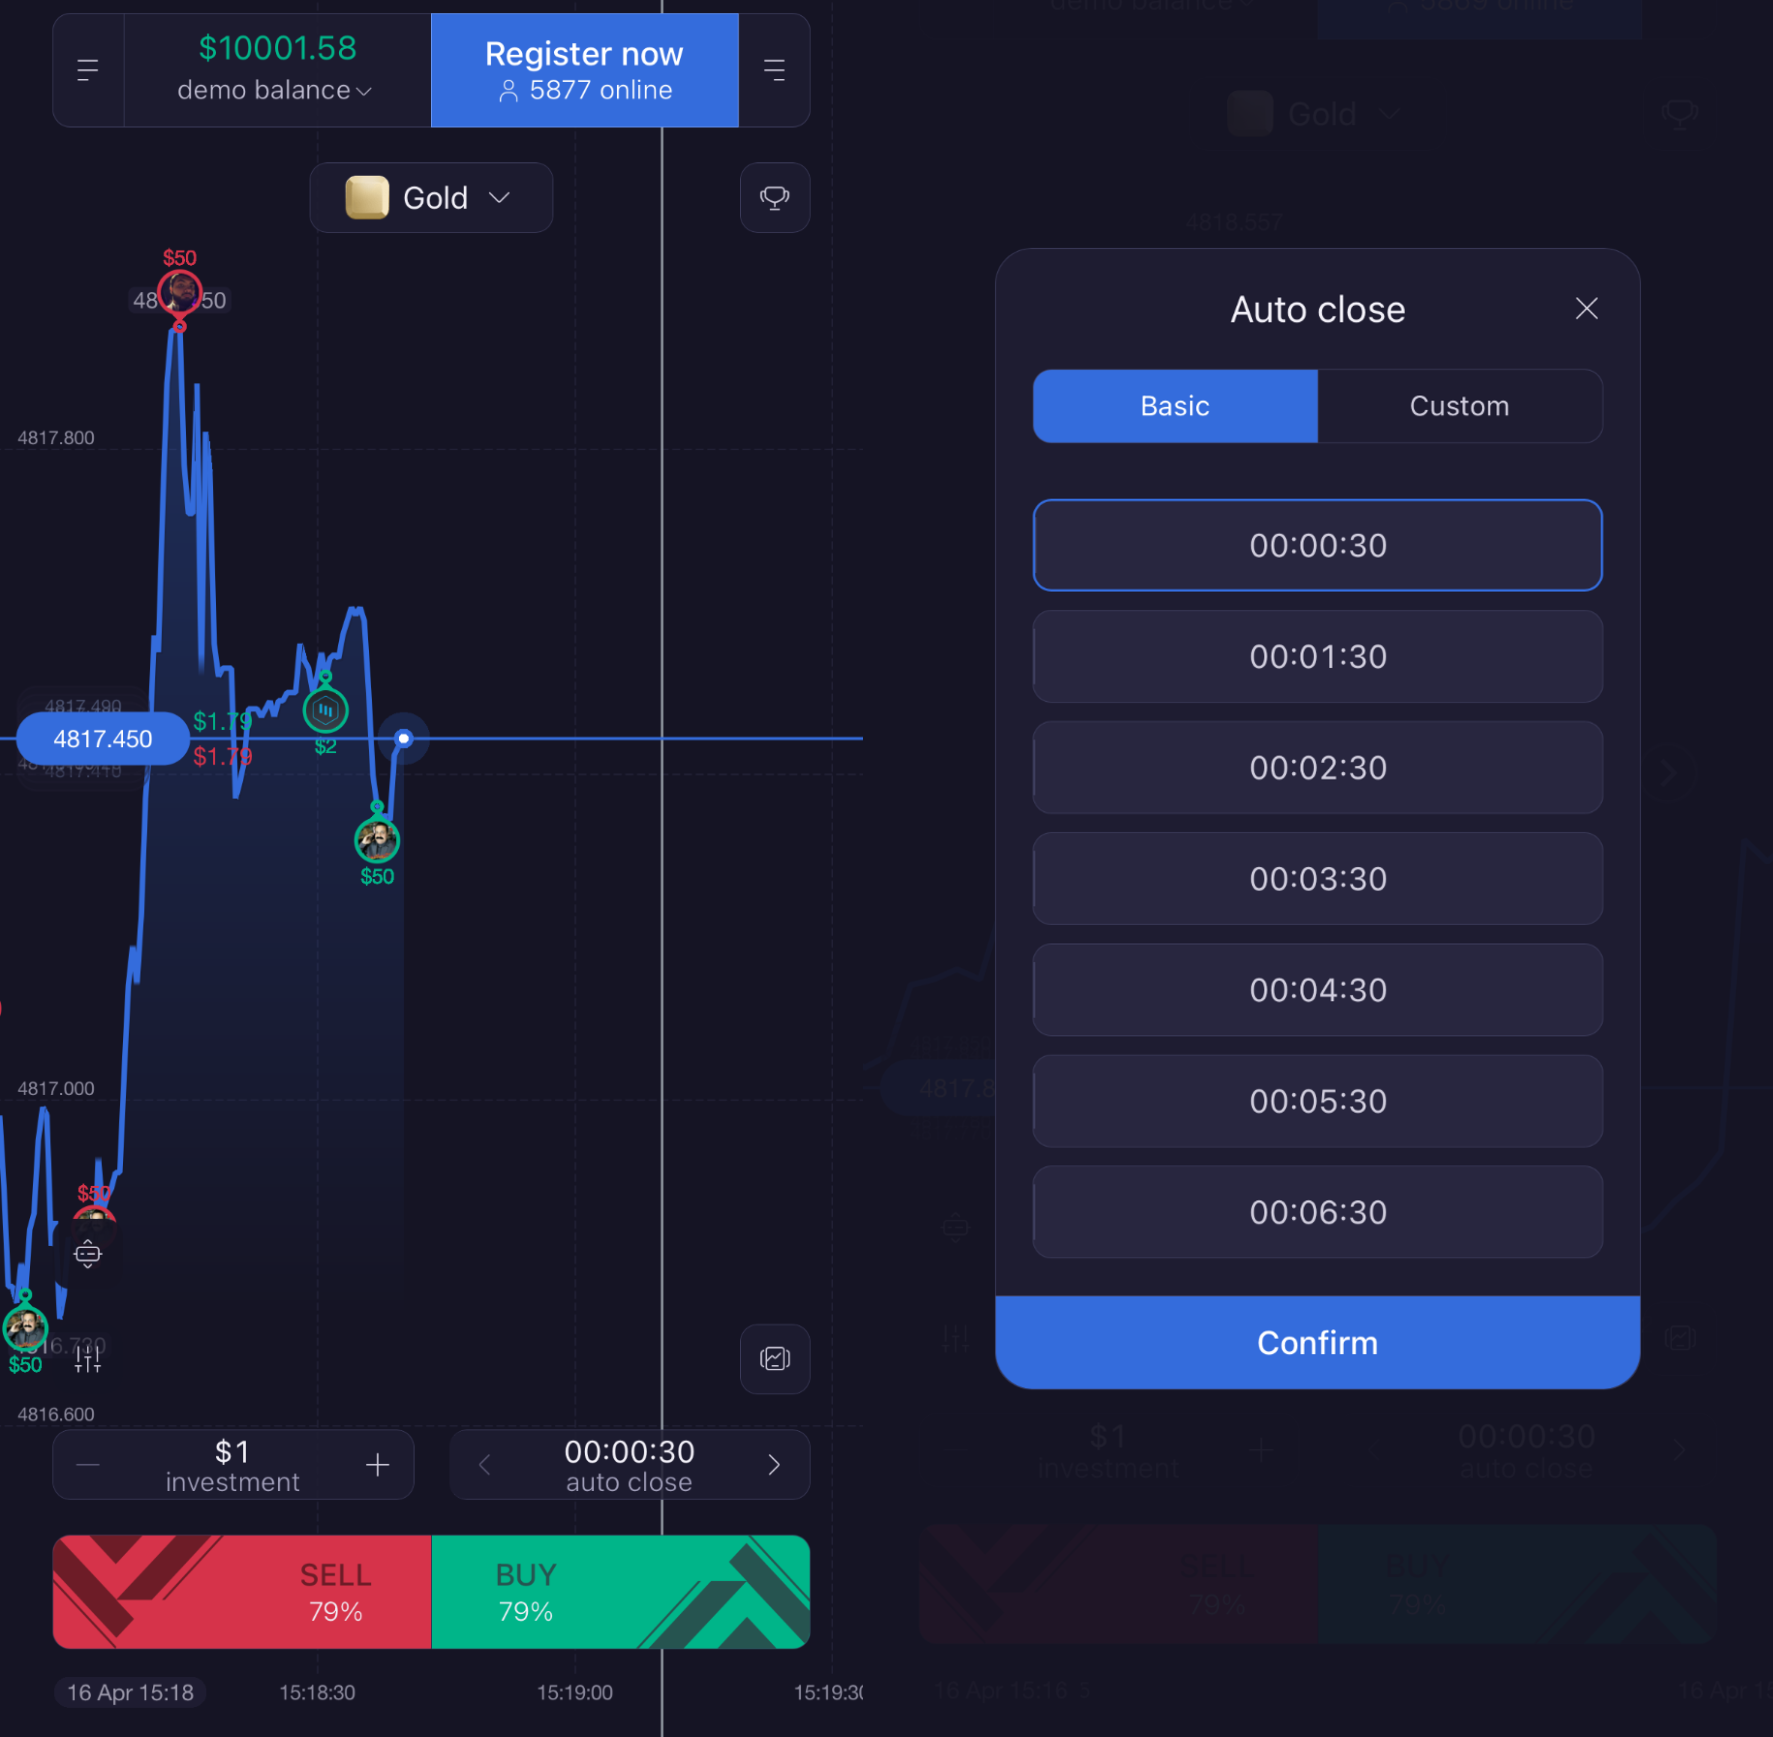
Changing colors, zoom levels, and timeframes helps reduce visual clutter and improves focus. For instance, zooming in too far can make small movements seem more important than they are, while zooming out too much may hide useful details. And too bright colors can distract you from the important details.
Consistency is also key. When your chart setup matches your trading style, it becomes easier to read and react to market behavior without hesitation.
A well-adjusted chart supports clearer thinking, especially during active trading periods.
Advantages of Using the Right Chart Setup
When charts are aligned with your preferences, analysis becomes more efficient.
Recognizing patterns like trends or key price levels becomes more natural, which helps reduce the time spent trying to interpret unclear visuals.
Although no chart guarantees results, a clear display allows for more structured observation and reduces unnecessary confusion.
In practical terms, this means less time adjusting your view and more time focusing on market behavior.
Using Charts to Stay Objective
Emotional decision-making is one of the biggest challenges in trading, particularly for beginners.
EO Broker’s chart tools are designed to help users rely on observable data instead of reacting impulsively. By studying price movements and planning actions in advance, traders can approach the market more calmly.
Features such as real-time updates, multiple chart formats, and adjustable timeframes provide different ways to analyze the same situation.
This encourages a more disciplined mindset, where decisions are based on information rather than instinct. This helps to look at the market from different angles.
Who Can Benefit From This Guide
This content is most useful for new traders who are still learning how to read charts and interpret price action.
It can also help users who feel uncertain when analyzing the market or want to improve their current approach.
Additionally, those who explain trading concepts to others — such as affiliates or content creators — may find it helpful to better understand how visual tools influence interpretation.
Mistakes to Watch Out For
One common issue is relying on a single chart type for every situation. While familiarity is helpful, different conditions may require different views.
Another mistake is ignoring chart settings. Timeframes and zoom levels play a major role in how price movements appear.
Short-term charts can show patterns that disappear on longer timeframes, which can lead to misinterpretation if not considered carefully; that’s why it's important to check multiple timeframes.
Finally, unclear visuals can trigger emotional reactions. Taking a moment to adjust the chart often helps restore perspective.
Charts vs. Account Features
Charts are just one part of the EO Broker platform. They are designed for analysis, while other features handle account-related tasks.
Verification processes and withdrawals, for example, are separate from chart functionality. Keeping your account organized ensures smoother operations when managing funds.
Understanding this separation allows traders to focus on analysis without mixing it up with administrative processes.
Different Charts, Different Interpretations
Two traders can look at the same asset and come to different conclusions simply based on the chart they use.
A line chart might show a steady upward movement, while a candlestick chart reveals multiple short-term reversals within that trend.
Both perspectives are valid — they just highlight different aspects of the same data. By switching between chart types, traders can combine these views and develop a more complete understanding of market behavior.
FAQ
Does EO Broker modify price data?
No. The platform displays market data as it is received. Differences in appearance are caused by chart settings, not changes to the data itself.
Do chart styles influence the market?
No. Charts only change how information is presented, not the actual price movement.
What’s the easiest chart for beginners?
Line charts are usually the simplest starting point. As experience grows, many traders transition to candlestick charts for more detailed analysis.
Why do charts look different for the same asset?
Each format focuses on different aspects of price data. Some smooth out movements, while others highlight volatility.
Can customization improve performance?
Customization improves visibility and understanding, but it does not guarantee better results.
Are charts linked to withdrawals or verification?
No. Chart tools are separate from account-related features such as verification and payouts.
You can explore helpful information about the platform in our blog.
Final Thoughts
EO Broker charts turn complex market data into visuals that are easier to interpret. By exploring different chart types and adjusting settings to suit your needs, you can approach analysis with greater clarity.
As your understanding improves, decision-making becomes more structured and less reactive. Combined with good account management habits, this leads to a more organized trading experience.
Charts themselves don’t predict outcomes, but they do make information easier to process. That clarity helps build confidence, and over time, confidence supports more consistent decision-making.
For best results, traders should combine chart usage with practice, demo trading, and gradual skill development rather than relying on charts alone. You can try different types of charts right now on EO Broker.
Latest Posts
Trading Education
Trading News
Trading Strategies
Promotions & Tournaments
Success Stories & Tips
Platform Updates
Global events, stocks, crypto, forex