



 10 minutes to read
2026-05-07
Saira Khan
How to Read Economic Calendars Like a Pro
For many beginners, economic calendars feel overwhelming at first glance. There are dozens of indicators, unfamiliar abbreviations, and constant updates that seem difficult to interpret in real time. It’s not always clear which events actually matter or how they influence market movement.
This confusion often leads to two common reactions: either ignoring economic data completely or reacting emotionally to headlines without understanding their meaning. Both approaches make it harder to build confidence in trading decisions.
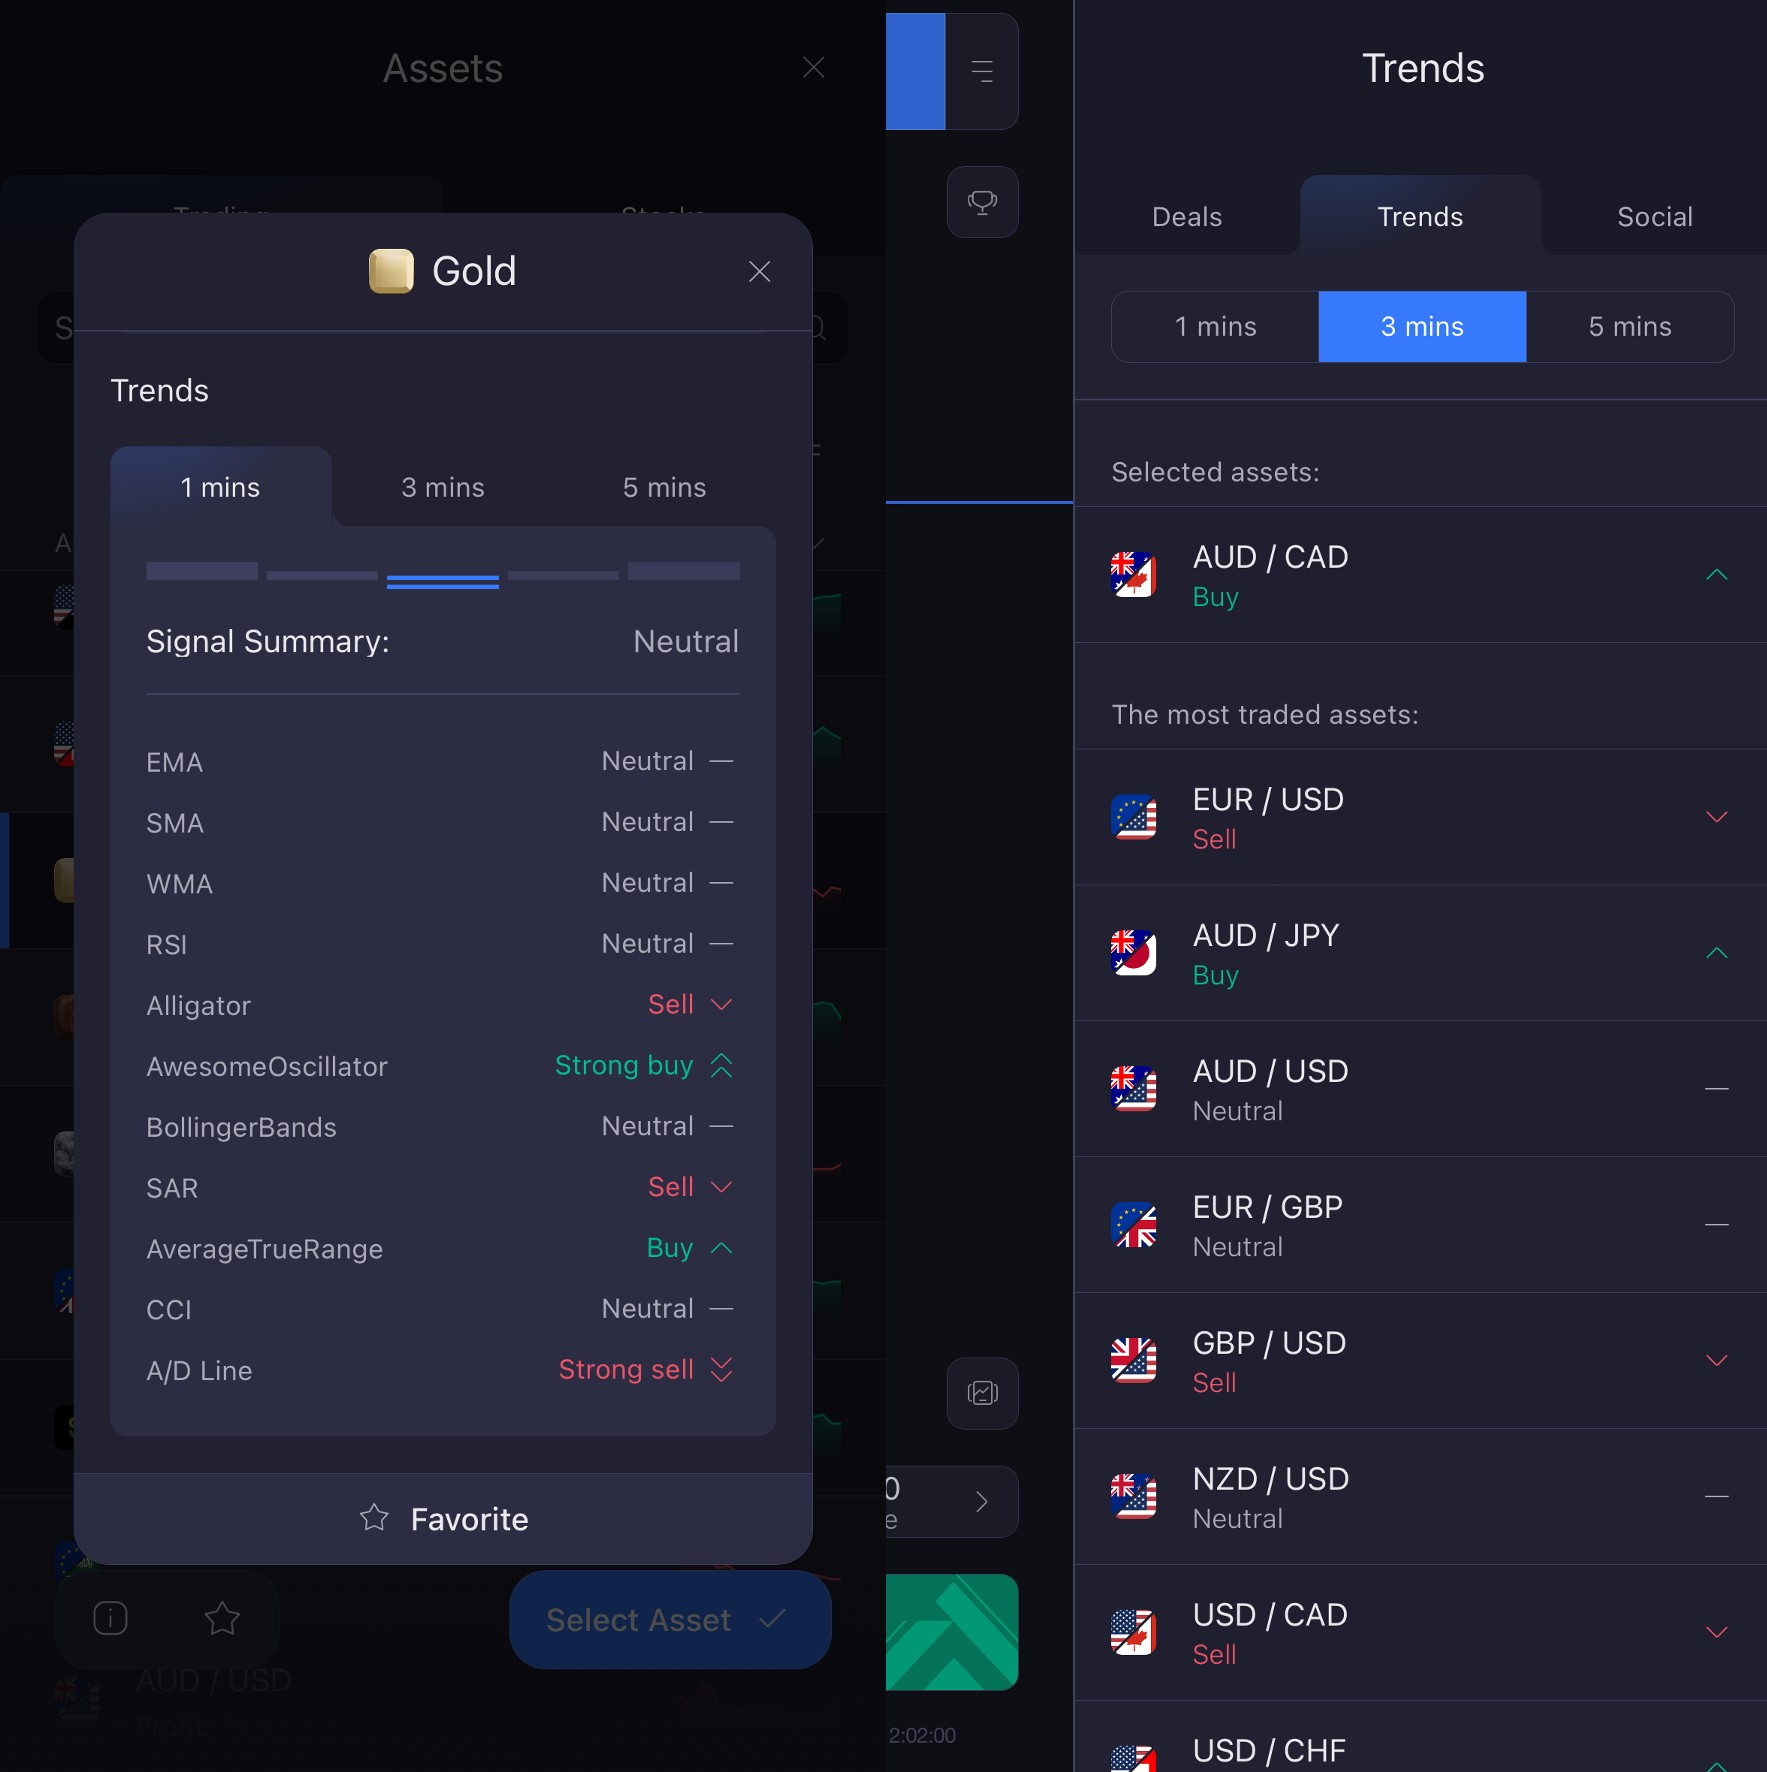
That’s where structure and clarity make a difference. Platforms like EO Broker help simplify this process by presenting economic events in a clean, visual format alongside price charts. Features such as color-coded impact labels make it easier to quickly identify high-importance events, while filters allow users to focus only on relevant countries or indicators. Built-in timers and countdowns to releases help users stay aware of timing without constant checking. Instead of sorting through dense reports, users can focus on the most relevant data and see how markets react in real time.
This guide is designed for beginners, busy traders, and anyone exploring fundamental analysis for beginners. It will show you how to read economic calendars step by step, understand key indicators, and use this information more confidently during high-impact news releases.
Why Simplicity Matters When Reading Economic Calendars
When markets react to economic news, they can move quickly. During events like NFP releases, spreads often widen, and candlesticks can shift rapidly within seconds. If the information is presented in a cluttered or overly technical way, it becomes difficult to process what’s happening in time.
A simplified economic calendar removes that friction. Instead of scanning long reports, traders can focus on a few essential details: the event, its importance, and the expected outcome.
Clear layouts make it easier to:
- Identify high-impact news releases without distraction
- Understand what each event represents
- React with more confidence instead of hesitation
For example, during a major announcement, such as an interest rate decision, a clean interface lets you immediately see whether the result matches expectations. This helps reduce guesswork and emotional reactions.
Simplicity also plays a role in learning. When beginners start with a few key indicators instead of dozens, they build understanding step by step rather than feeling overwhelmed from the start.
Understanding Key Elements of an Economic Calendar
To learn how to read economic calendars effectively, it’s important to understand what the main indicators represent and why they matter. It’s also worth noting that these indicators differ not only in what they measure, but in how often they are released and how strongly they tend to influence the market. Some reports come out monthly or quarterly and can trigger sharp, immediate reactions, while others have a more gradual or limited impact. Recognizing both the frequency and the typical market sensitivity of each indicator helps traders prioritize which events to focus on and how much attention to give them in real time.
CPI (Consumer Price Index)
CPI measures inflation by tracking changes in the prices of goods and services. It’s one of the most closely watched economic indicators for traders because it directly influences central bank decisions.
If inflation rises faster than expected, markets may anticipate interest rate increases. This can affect currencies, stocks, and commodities almost immediately.
NFP (Non-Farm Payrolls)
NFP is a monthly report that shows how many jobs were added in the U.S. economy, excluding agriculture. It’s considered one of the most impactful releases.
Strong job growth often signals economic strength, while weaker numbers may suggest slowing activity. Because of this, NFP can trigger significant volatility in a short period.
GDP (Gross Domestic Product)
GDP reflects the overall economic output of a country. It provides a broader view of economic health compared to more frequent indicators. GDP is typically released in three stages — advance, preliminary, and final — with each version refining the previous estimate as more data becomes available.
While GDP doesn’t usually cause instant market spikes like NFP, it helps shape long-term sentiment and expectations, especially as revisions between these releases can subtly shift how traders interpret economic strength over time.
Interest Rate Decisions
Central banks adjust interest rates to control inflation and support economic stability. These decisions are among the most important events in any economic calendar.
Even small changes — or hints about future policy — can shift market direction quickly.
PMI (Purchasing Managers’ Index)
PMI measures business activity in sectors like manufacturing and services, primarily Manufacturing PMI and Services PMI.
Manufacturing PMI focuses on factories and production — tracking things like new orders, output levels, and employment in the industrial sector. Services PMI, on the other hand, reflects activity in areas like finance, retail, transportation, and hospitality — essentially the broader service economy.
Both indicators provide early insight into economic trends before official data like GDP is released. Because they are forward-looking and based on business sentiment, traders often use PMI readings to anticipate potential market shifts, especially when there are strong changes in either sector.
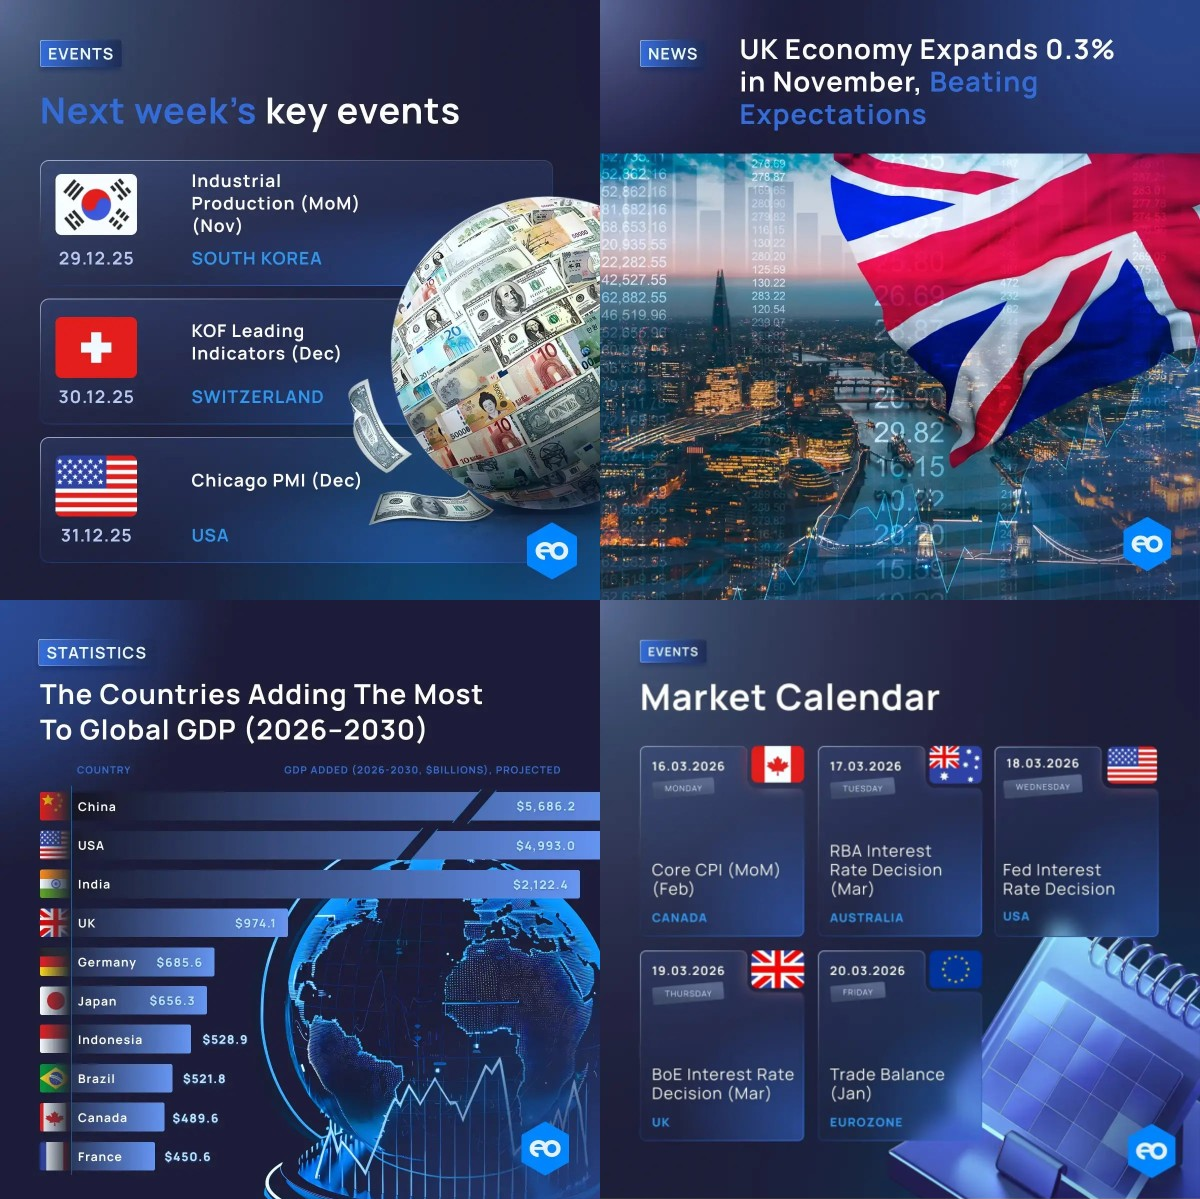
Why These Indicators Matter
Each of these indicators plays a different role, but they all influence how economic data affects markets. Instead of trying to follow everything, beginners should focus on high-impact news releases first.
A simple approach is to track:
- Inflation data (CPI)
- Employment data (NFP)
- Central bank decisions
- PMI — early trend signal
These events tend to move markets the most and provide a strong foundation for learning fundamental tools.
Why an Intuitive Interface Changes Everything
Even when you understand economic indicators, the way information is presented still matters.
A well-designed interface helps you:
- Quickly identify important events
- Filter out low-impact data
- Focus on what aligns with your strategy
On EO Broker, economic events can be viewed alongside price charts, making it easier to connect news with actual market reactions. This reduces the gap between theory and practice.
For example, if the CPI actual comes in higher than the forecast, you might see an immediate spike in volatility on the chart. Watching these reactions over time allows traders to develop a more intuitive understanding of how different events influence price action in real market conditions.
An intuitive layout also reduces mistakes. When everything is clearly labeled and easy to navigate, there’s less risk of misreading data or missing important updates.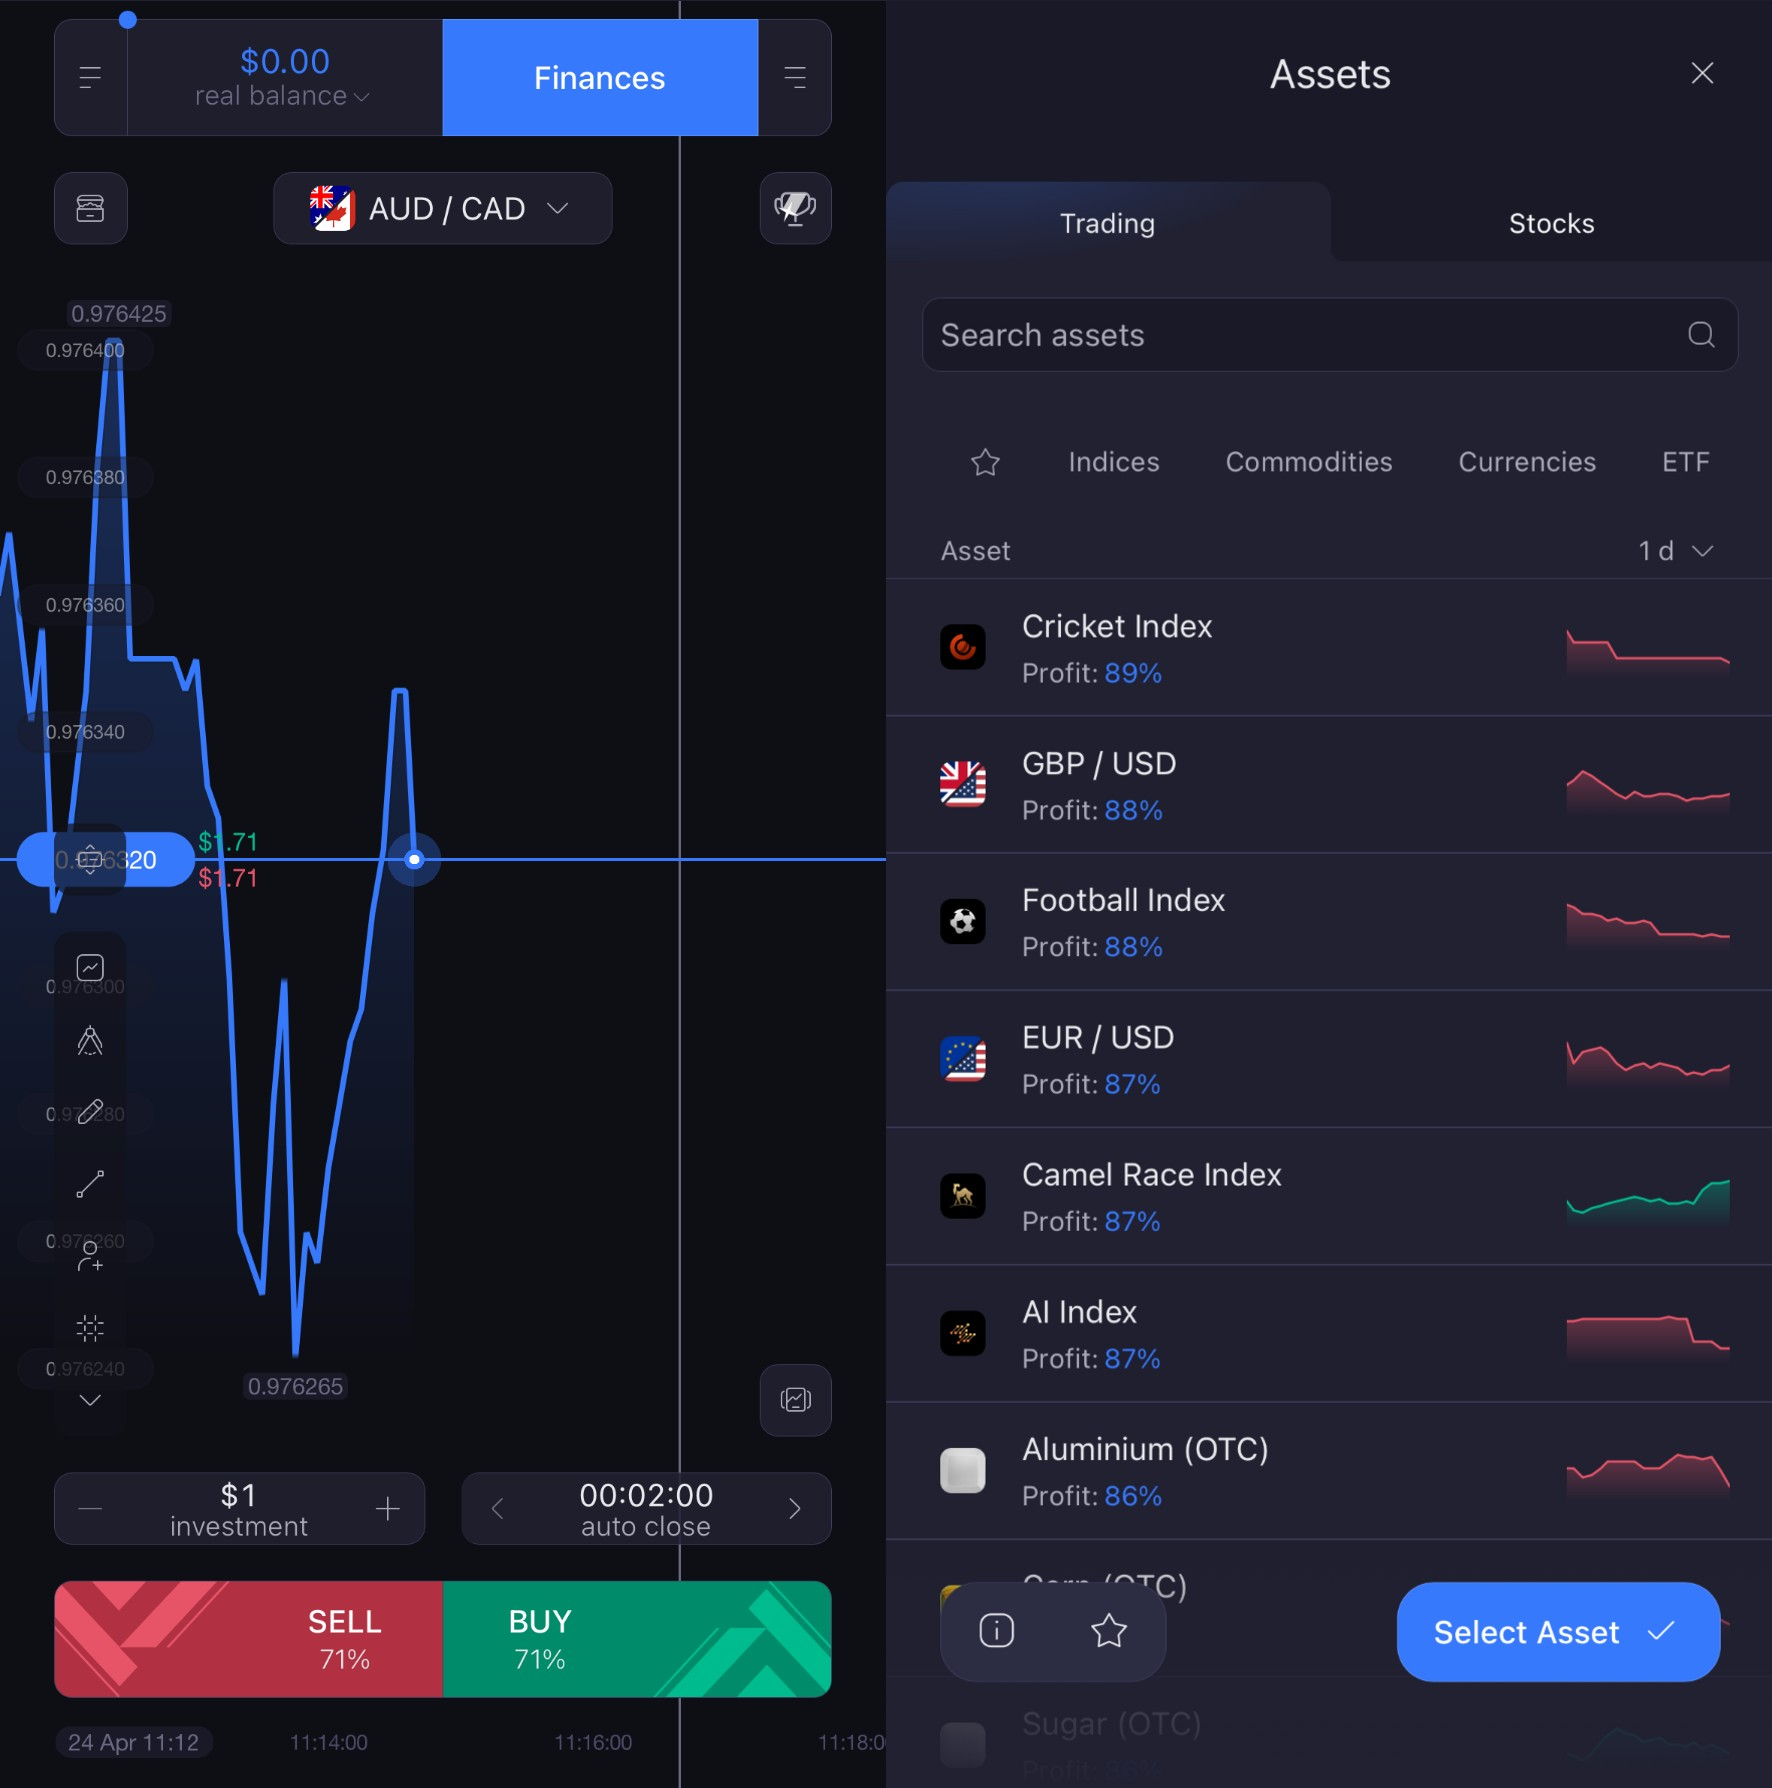
Key Benefits of a Simplified Economic Calendar Experience
A structured, easy-to-read calendar makes the entire trading process smoother.
One key benefit is fewer impulsive trades. By clearly seeing when high-impact events are scheduled, beginners can resist reacting to every minor market movement and focus on meaningful opportunities.
It also supports better risk planning. Knowing the timing and potential impact of economic releases allows traders to size positions and set stops more thoughtfully, rather than trading blindly.
Faster learning is another key advantage. Beginners can quickly recognize patterns, such as how markets react to repeated types of news events.
Another benefit is improved timing. When you know when key events are scheduled, you can plan your sessions more effectively instead of reacting randomly.
Clarity also reduces stress. Instead of feeling pressured by constant updates, you can focus only on the events that matter most.
Over time, this creates a more consistent workflow. Traders begin to rely on structured data rather than noise, which helps build confidence and discipline.
Who Should Follow This Guide
Anyone can feel overwhelmed by the sheer volume of economic data. This guide is for anyone who feels unsure about how to interpret releases, identify which events matter most, and connect them to price action in a meaningful way.
It’s a good fit for:
- Beginners who find economic indicators confusing
- Users who rely on fundamental analysis for beginners but lack structure
- Traders who want to understand high-impact news releases more clearly
- Anyone looking for a calmer, more organized approach to market analysis
Even experienced users can benefit from simplifying their workflow and focusing on the most relevant information.
Common Mistakes to Avoid
When learning how to read economic calendars, mistakes are part of the process. However, some patterns tend to slow progress more than others.
One common issue is trying to follow too many indicators at once. Beginners often jump into complex data instead of starting with a few high-impact events, which creates confusion rather than clarity.
Another mistake is ignoring expectations. Economic calendars usually show previous values, forecasts, and actual results. Without comparing these, it’s difficult to understand why the market reacts the way it does.
Reacting to headlines without context is another challenge. For example, seeing “inflation rises” doesn’t mean much unless you know whether it was higher or lower than expected.
Timing also matters. Overlooking time zones or release schedules can lead to entering the market too early or too late.
Finally, treating all events as equally important can dilute focus. Not every data release moves the market significantly, so learning to prioritize is key.
FAQ
What is an economic calendar?
An economic calendar is a schedule of upcoming financial events and data releases, such as inflation reports, employment figures, and central bank decisions.
Why are economic calendars important for traders?
They help traders anticipate market volatility and understand how economic data affects markets, making it easier to plan trades and manage timing.
What are high-impact news releases?
These are events that typically cause strong market reactions, such as NFP, CPI, and interest rate decisions.
How can beginners start using economic calendars?
Start by focusing on a few major indicators and observing how markets react. Over time, expand your knowledge gradually.
Do I need to understand every indicator?
No. It’s more effective to understand a small number of key indicators well rather than trying to follow everything at once.
How does EO Broker help with economic calendars?
EO Broker provides a clear, user-friendly interface where traders can view economic events alongside charts, making it easier to connect data with market behavior.
Conclusion
Learning how to read economic calendars is an important step toward understanding market behavior. While it may seem complex at first, focusing on key indicators and using a structured approach makes the process much more manageable.
By paying attention to high-impact events, comparing forecasts with actual results, and observing how markets react, traders gradually develop a clearer perspective.
Platforms like EO Broker support this learning process by presenting data in a simple, visual way. This allows users to move from confusion to clarity and build confidence over time.
With practice, economic calendars become less of a challenge and more of a practical tool — one that helps you approach the markets with better timing, stronger awareness, and a more structured mindset.
Open the economic calendar and keep track of the key events next week.
Latest Posts
Trading Education
Trading News
Trading Strategies
Promotions & Tournaments
Success Stories & Tips
Platform Updates
Global events, stocks, crypto, forex