



 10 minutes to read
2026-07-21
Hassan Abbas
Trend Investing on EO Broker: A Simple Guide to Understanding Market Direction
Markets rarely move randomly. Over time, prices tend to move in a direction — rising, falling, or staying within a range. Learning to recognize these patterns can make a big difference in how you approach trading.
This is where trend investing comes in. Instead of reacting to every small price change, traders focus on the overall direction and look for opportunities within that movement.
For beginners, this idea sounds simple but can feel difficult in practice. Charts can look busy, indicators may seem complicated, and it’s not always obvious whether a move is just temporary or the start of something bigger. Traders can get lost in the chaos of charts. That’s why it’s important to have the tools that can make it easier to analyze the data and make decisions.
EO Broker helps simplify this process by presenting market data in a clean, easy-to-follow format. With straightforward charting tools and clear visuals, users can focus on understanding price movement rather than navigating a complex interface.
This guide explains how trends form, how to recognize them, and which tools on EO Broker can help you follow market momentum more confidently. After reading this, you will be able to determine market direction faster and make more confident decisions.
Visit our website to explore the platform and create your account.
How Trends Develop in the Market
A trend is simply the general direction in which a price moves over time. It doesn’t happen by chance — trends are usually driven by changes in supply and demand, economic updates, or shifts in market sentiment.
When looking at charts, you’ll typically see three types of market behavior.
Upward Trends
An upward trend forms when prices continue to move higher over time. This usually reflects growing demand, where buyers are willing to enter at increasing price levels.
On a chart, this often appears as a steady pattern of rising highs and rising lows. Even when the price pulls back slightly, the overall direction remains upward.
Downward Trends
A downward trend develops when selling pressure dominates. Prices gradually move lower as more traders are willing to sell than buy.
This is usually visible as a sequence of lower highs and lower lows, showing that each attempt to rise is weaker than the previous one. That’s how the markets often behave during economic downturns.

Sideways Movement
Sometimes the market doesn’t show a clear direction. Prices move within a range, bouncing between support and resistance levels.
In these conditions, trend-based strategies tend to be less effective, since there is no strong momentum to follow.
Recognizing when the market is trending — and when it’s not — is a key part of building a structured approach. During such periods, traders often make mistakes by trying to guess the direction.
Tools That Help You Spot Trends on EO Broker
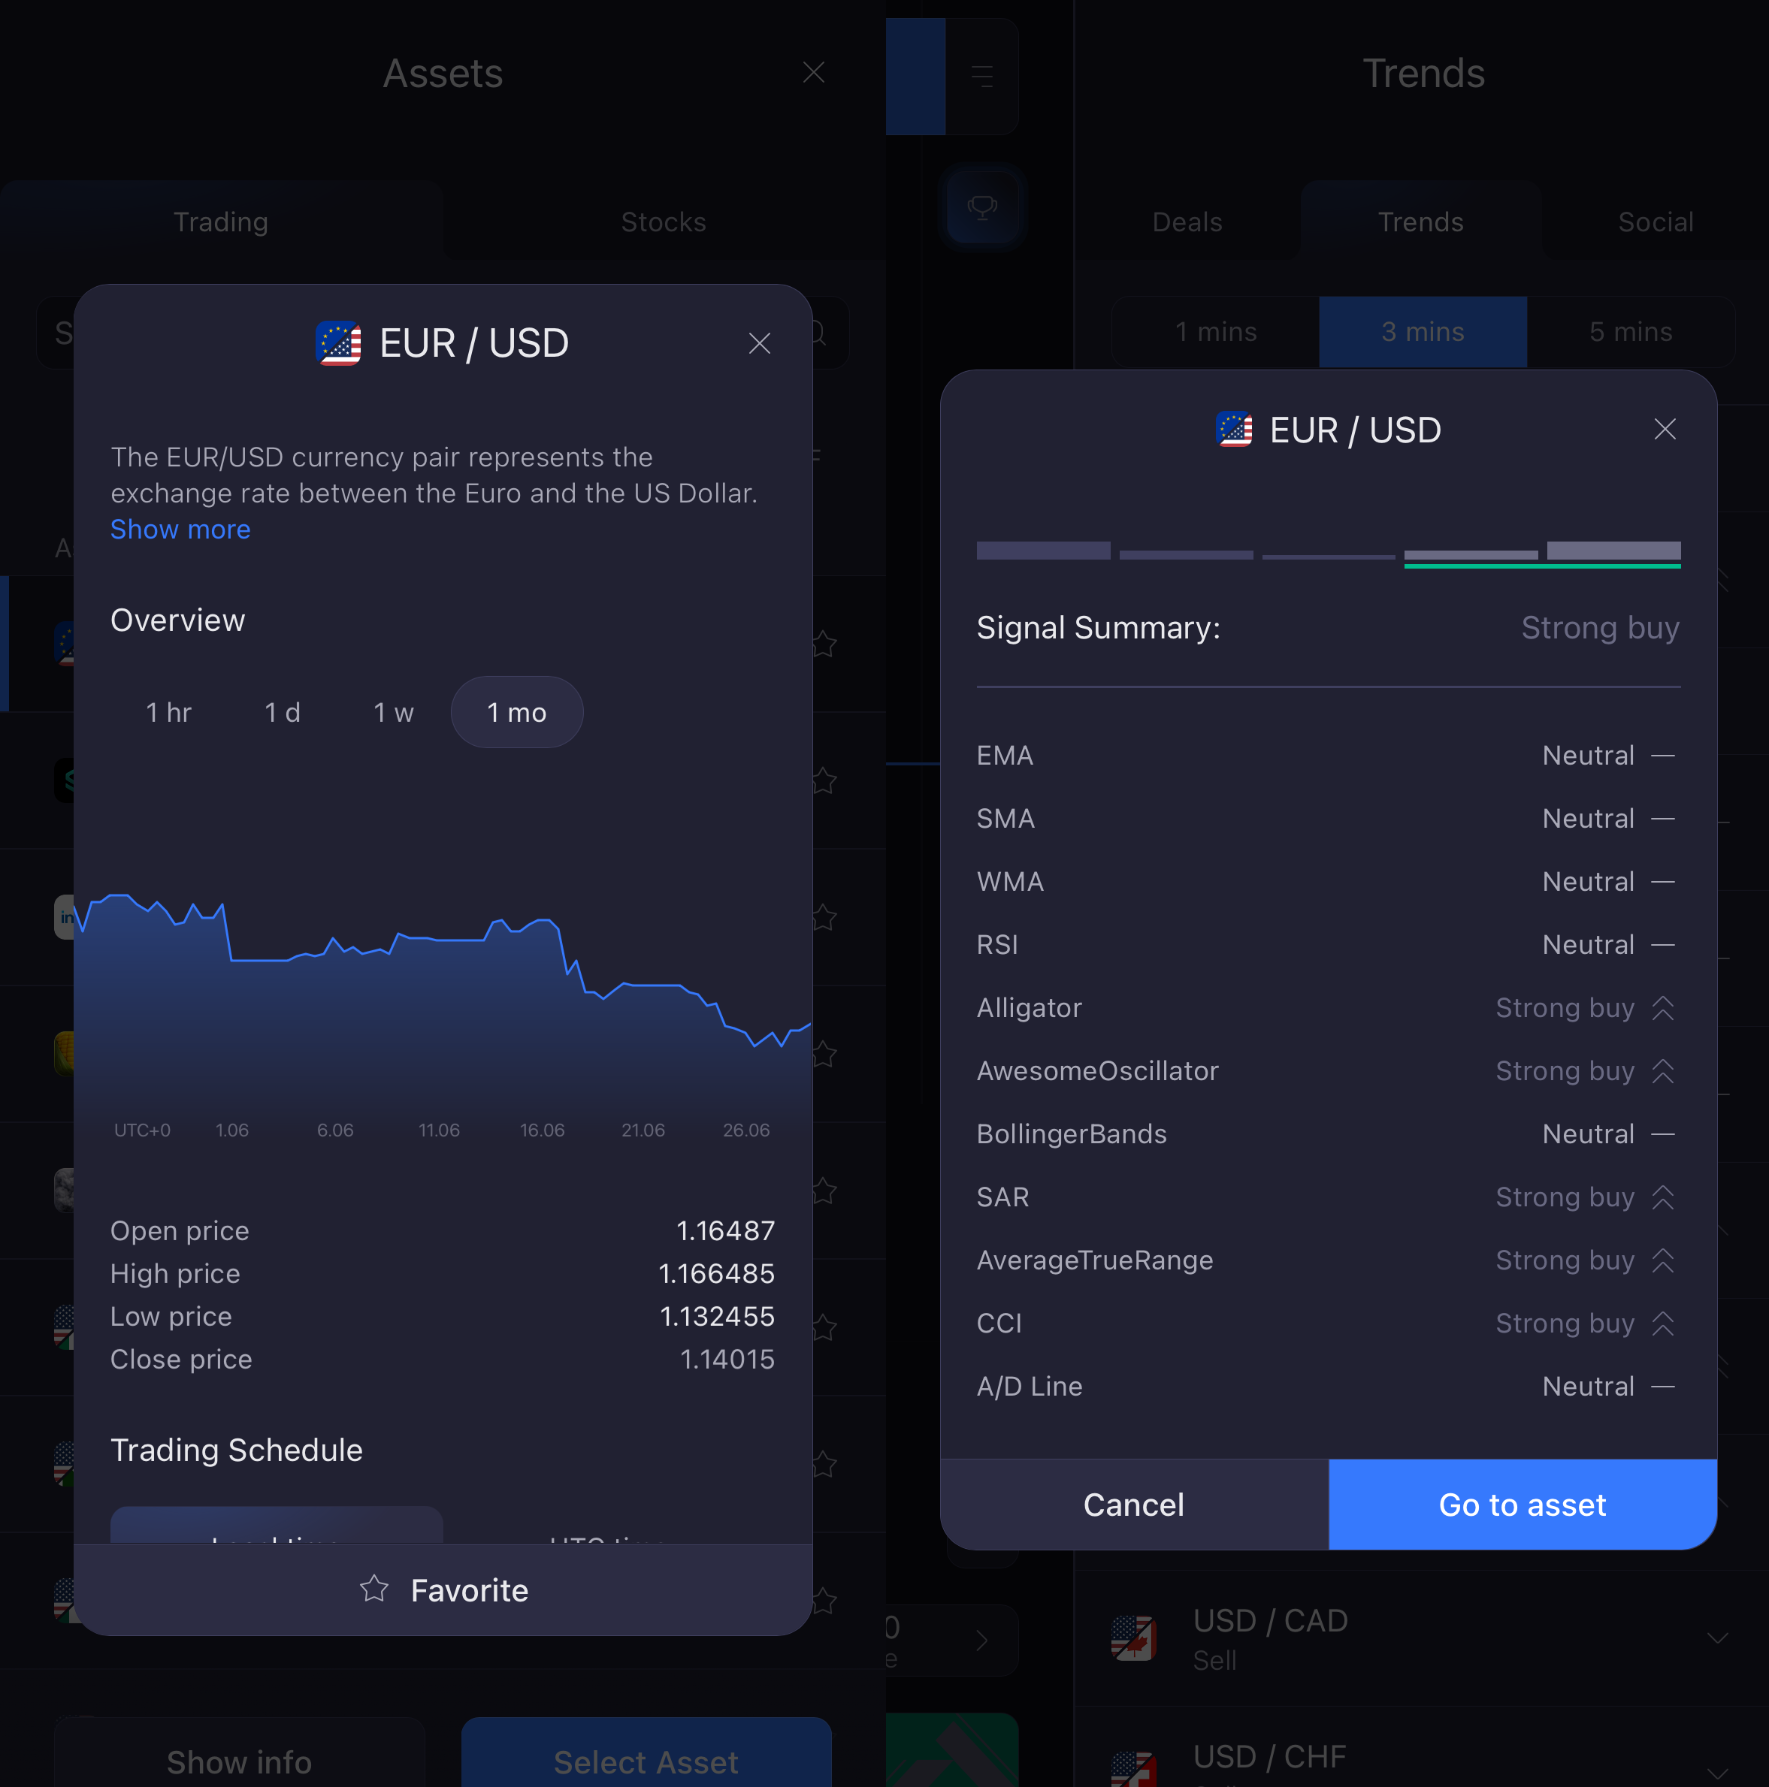
EO Broker offers a set of simple tools that make it easier to read market direction without overcomplicating the process.
Moving Averages
Moving averages help smooth out price data, making trends easier to see. Instead of focusing on every small movement, they highlight the general direction over a selected period.
Traders often compare short-term and long-term averages. When shorter averages move above longer ones, it can suggest strengthening upward momentum. When they move below, it may point to downward pressure.
Breakout Areas
Markets often pause within a price range before making a stronger move. When the price breaks out of that range, it can signal that momentum is building.
For example, if price repeatedly struggles to move above a certain level and then finally breaks through it, that shift may attract more interest and push the trend further.
Watching how the price behaves around these levels helps identify when a market might be gaining direction.
Price Action
Beyond indicators, simply observing how the price moves can be very powerful.
By looking at trendlines, key levels, and how candles form, traders can get a clearer sense of market behavior. This approach is widely used by professionals because it reflects real-time price action rather than delayed signals. EO Broker’s charts make this easier by keeping the display clean and readable, allowing patterns to stand out naturally.
Why a Clear Interface Makes a Difference
The way information is presented has a big impact on how well you can understand it.
Some platforms overload users with too many tools at once, which can make analysis harder rather than easier. EO Broker takes a more streamlined approach, keeping charts and features organized so users can focus on what matters.
- When charts are clear, it becomes easier to:
- Recognize trend direction
- Spot key levels
- Understand how the price reacts over time
This clarity also helps with decision-making. Instead of second-guessing what you’re seeing, you can concentrate on analyzing the movement itself.
Benefits of Following Trends
Approaching the market with a trend-based mindset helps create structure. Rather than reacting to every fluctuation, you begin to view price movement in context. This makes it easier to understand whether the market is strengthening, weakening, or simply pausing.
Another advantage is consistency. When you follow a repeatable process — identifying direction, waiting for confirmation, and observing pullbacks — your decisions become more controlled.
For example, in an upward trend, you might wait for a temporary dip before considering your next move. This kind of patience often leads to clearer setups and less emotional trading.
Who This Guide Is For
This guide is especially useful for beginners who want a straightforward way to understand market movement without relying on too many indicators.
It’s also helpful for traders who feel uncertain when reading charts or who tend to react quickly to short-term price changes. Focusing on trends provides a clearer framework and reduces that uncertainty.
If you prefer a more structured, visual approach to analysis — rather than guessing or chasing quick movements — this method can help you build more consistent habits over time.
Common Mistakes When Following Trends
Even though trend trading is based on simple ideas, it’s easy to make mistakes early on.
One of the most common is assuming a trend exists without proper confirmation. Just because price moves in one direction briefly doesn’t mean a real trend has formed.
Another issue is relying too heavily on a single indicator. While tools like moving averages are helpful, they work best when combined with overall chart observation.
Many beginners also misinterpret pullbacks. Trends rarely move in straight lines, and temporary reversals are part of normal market behavior. Reacting too quickly to these movements can lead to confusion.
It’s also important to avoid applying trend strategies in sideways markets. Without clear direction, signals become less reliable.
Finally, short-term volatility can sometimes look like a new trend. Looking at slightly longer timeframes helps provide better context.
FAQs
What is trend investing?
Trend investing focuses on identifying the overall direction of the market and aligning your analysis with that movement, rather than reacting to every short-term change.
Is EO Broker suitable for beginners?
Yes. EO Broker is designed with simplicity in mind, offering clear charts and easy navigation that make it easier for new users to understand price behavior.
Which tools are most useful for identifying trends?
Tools like moving averages, support and resistance levels, breakout zones, and price action analysis all help provide insight into market direction.
Do trends last forever?
No. Trends can change as new information enters the market or as sentiment shifts. That’s why it’s important to keep observing price behavior rather than assuming a trend will continue indefinitely.
Why combine indicators with price action?
Indicators provide a simplified view of past data, while price action shows how the market is behaving in real time. Using both together gives a more balanced perspective.
How can you tell the difference between a pullback and a reversal?
A pullback is usually a temporary pause within a trend, while a reversal suggests a deeper change in direction. Observing how the price behaves after the movement helps clarify the difference.
To Sum Up
Spotting trends is a key skill for any investor, and EO Broker makes it easier with its clean, intuitive charts and simple tools.
The best way to build confidence is hands-on practice: start tracking trends, observe momentum, and refine your approach over time.
Try EO Broker’s tools today and see for yourself — developing trend recognition is a skill that grows with consistent practice, helping you make smarter, more structured decisions.
Latest Posts
Trading Education
Trading News
Trading Strategies
Promotions & Tournaments
Success Stories & Tips
Platform Updates
Global events, stocks, crypto, forex